Module 5: Analytics Dashboard
Track human agent performance with conversation analytics
Module 5: Analytics Dashboard
Duration: 30 minutes
Objective: Understand CORA's analytics dashboard for tracking human agent performance and training progress.
🎯 Learning Objectives
By the end of this module, you will:
- Understand the difference between human agent metrics (this module) and IT/system metrics (Module 6)
- View conversation scores from the analytics dashboard
- Interpret the 5-criteria scoring system
- Track performance trends over time
- Understand Azure Table Storage for score persistence
🧭 Module 5 vs Module 6: What’s the Difference?
This is important! CORA has TWO types of metrics:
📊 Module 5: Human Agent Success Metrics (YOU ARE HERE!)
Focus: How well are customer service agents performing?
Who cares: Training managers, HR, quality assurance teams
Metrics tracked:
- ✅ Conversation scores (0-25 points)
- ✅ 5 performance criteria (professionalism, communication, problem resolution, empathy, efficiency)
- ✅ Strengths and areas for improvement
- ✅ Performance trends over time per agent
- ✅ Training progress and skill development
Where it’s stored: Azure Table Storage (simple, lightweight, perfect for analytics aggregation)
Think of it as: Report cards for customer service agents 📝
🔧 Module 6: IT/System Metrics (COMING NEXT!)
Focus: How well is the CORA system performing?
Who cares: DevOps, IT operations, developers
Metrics tracked:
- ✅ Application performance (response times, errors, uptime)
- ✅ Infrastructure health (CPU, memory, scaling events)
- ✅ AI model performance (token usage, latency, costs)
- ✅ OpenTelemetry traces (request flow, bottlenecks)
- ✅ AI Foundry evaluation (groundedness, relevance, coherence)
Where it’s stored: Application Insights, Azure Monitor, AI Foundry portal
Think of it as: System health dashboard for DevOps 🛠️
| Bottom Line: Module 5 = “How good are our agents?” | Module 6 = “How healthy is our system?” |
📊 The Analytics Dashboard
Accessing Your Performance Data
- Complete a conversation with CORA (any mood, any length)
- Click “Analyze Conversation” to get scored
- Click “📈 My Analytics” in the top-right header
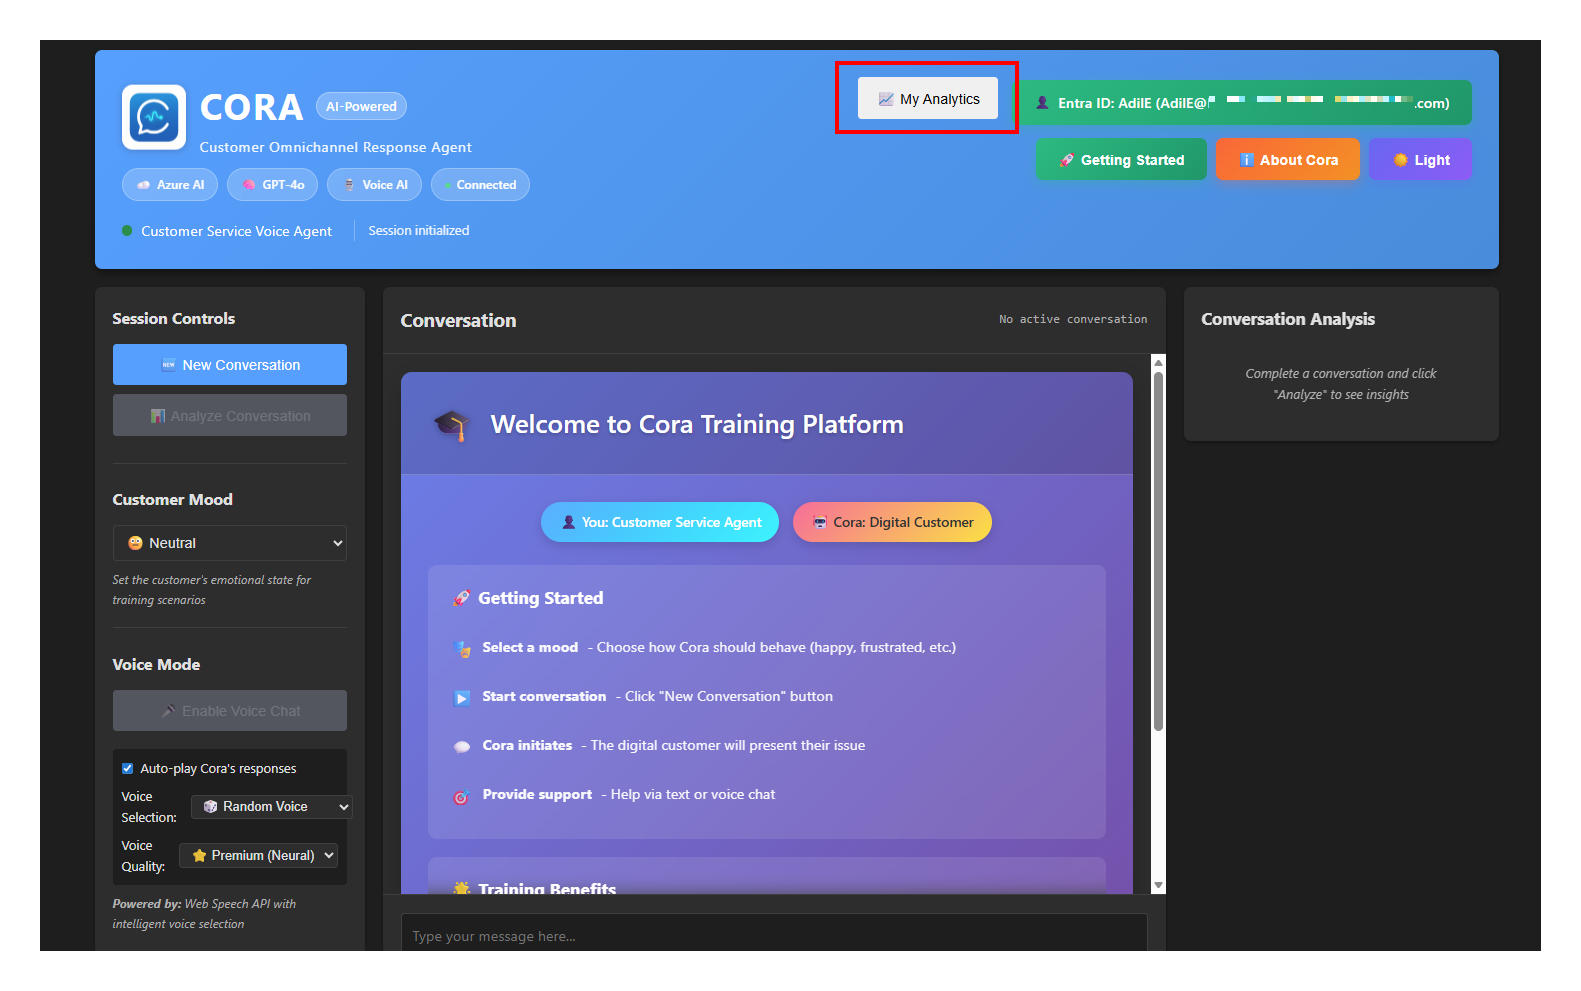
Click to enlarge
What You’ll See
The analytics dashboard shows:
📈 Performance Chart
- Multi-line graph showing your scores across all 5 criteria
- Each conversation is a data point
- Trends over time help identify improvement areas
📋 Conversation History Table
- List of all your scored conversations
- Date/time, total score, and individual criteria scores
- Message count per conversation
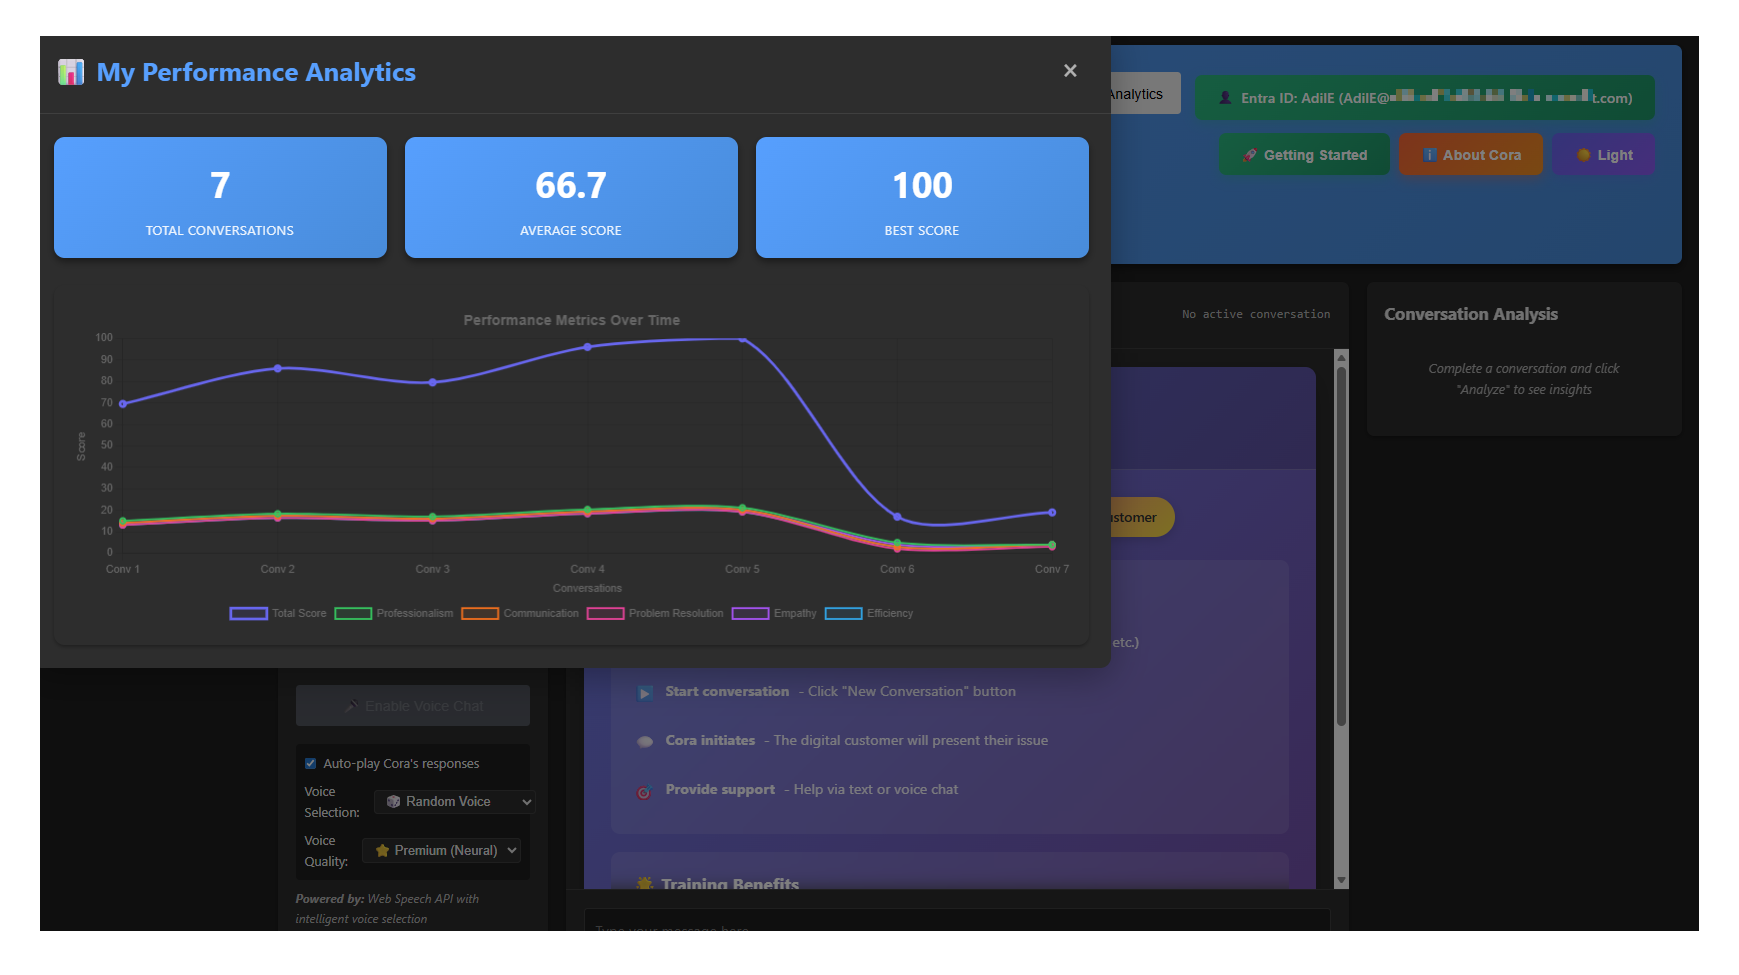
Click to enlarge
🏆 Understanding the 5-Criteria Scoring System
Each conversation is evaluated on 5 key performance indicators, rated 1-5 each (25 points total):
1. Professionalism & Courtesy (1-5 points)
What it measures:
- Polite and respectful tone
- Appropriate greetings and sign-offs
- Professional language (no slang, informal speech)
- Maintaining composure under pressure
Example high score (5/5):
“Good morning! I completely understand your frustration. Let me help you resolve this right away.”
Example low score (1/5):
“Yeah, whatever. What’s your problem?”
2. Communication Clarity (1-5 points)
What it measures:
- Clear, concise explanations
- Avoiding jargon or technical terms (unless appropriate)
- Structured responses (not rambling)
- Checking for understanding
Example high score (5/5):
“I’ll fix this in two steps: First, I’ll update your account. Second, I’ll send you a confirmation email. Does that make sense?”
Example low score (1/5):
“So, like, there’s this thing we need to do, and then maybe we can, uh, try something else if that doesn’t work…”
3. Problem Resolution (1-5 points)
What it measures:
- Identifying the actual issue
- Proposing actionable solutions
- Following through to resolution
- Confirming issue is resolved
Example high score (5/5):
“I’ve identified three possible causes. Let’s start with the most likely: resetting your password. If that doesn’t work, we’ll try the next solution.”
Example low score (1/5):
“I don’t know, maybe try turning it off and on again?”
4. Empathy & Active Listening (1-5 points)
What it measures:
- Acknowledging customer emotions
- Showing understanding and compassion
- Reflecting back customer concerns
- Building rapport
Example high score (5/5):
“I can hear how frustrating this has been for you. Waiting three days for a response is completely unacceptable. Let me make this right.”
Example low score (1/5):
“Okay, what’s the issue?”
5. Efficiency & Responsiveness (1-5 points)
What it measures:
- Quick response times
- Getting to the point (not overexplaining)
- Moving conversation toward resolution
- Respecting customer’s time
Example high score (5/5):
“I have your account pulled up. I can see the charge. I’ll refund it now—done! You’ll see it in 3-5 business days.”
Example low score (1/5):
“Let me tell you about our entire company history first… [5 minutes later] …so anyway, about your issue…”
📈 How CORA Calculates Scores
The Scoring Process
- You complete a conversation (as many messages as needed)
- You click “Analyze Conversation”
- CORA’s AI agent reviews the entire conversation transcript
- GPT-4o evaluates each of the 5 criteria (1-5 points each)
- Total score calculated (sum of 5 criteria = 0-25 points)
- Score stored in Azure Table Storage with your user identity
Important: Scores are tied to YOUR identity (email or user ID), so you can track your personal progress over time!
Behind the Scenes: Azure Table Storage
What is Azure Table Storage?
- NoSQL key-value storage service
- Lightweight, fast, and cost-effective
- Perfect for storing simple structured data (like scores!)
- No complex schema required
Where does it live?
- 🏢 Lives inside your Azure Storage Account (created in Module 1 with
azd up) - 📦 Storage Account contains:
- Table Storage (conversation scores) ← YOU ARE HERE
- Blob Storage (could store files, images)
- Queue Storage (could handle background tasks)
- File Storage (could mount file shares)
Think of it this way:
- Storage Account = The building
- Table Storage = One room in that building where scores are stored
- conversationscores table = The filing cabinet in that room
Security & Access Control
How does CORA access the Table Storage?
CORA uses Azure Managed Identity with role-based access control (RBAC):
1. The Container App has a Managed Identity (assigned during azd up)
- This is like giving your app a “passport” to access Azure resources
- No passwords, no API keys stored in code! 🔐
2. The Managed Identity is granted the Storage Table Data Contributor role
- This role allows:
- ✅ Read table data (query conversation scores)
- ✅ Write table data (save new scores)
- ✅ Update table data (modify existing scores)
- ✅ Delete table data (remove old scores)
- This role was automatically assigned by the Bicep infrastructure code in Module 2
3. The Python application connects using DefaultAzureCredential
from azure.identity import DefaultAzureCredential
from azure.data.tables import TableServiceClient

# Automatically uses Container App's Managed Identity
credential = DefaultAzureCredential()
table_endpoint = f"https://{storage_account_name}.table.core.windows.net"
table_service = TableServiceClient(endpoint=table_endpoint, credential=credential)
No passwords = No security breaches! 🛡️
Data Privacy & User Isolation
Important security feature:
Even though the CORA application has access to the entire conversationscores table, users can only see their own data!
How it works:
- You log into CORA (Azure AD, local dev, or anonymous)
- Your user identity is captured (email or user ID)
- When you click “My Analytics”:
- Python backend queries Table Storage with filter:
PartitionKey eq 'your-email@company.com' - Only YOUR scores are returned (not other users’ data)
- Python backend queries Table Storage with filter:
- Chart.js displays only your data in the browser
Example:
# In storage_service.py
def get_user_scores(self, user_identity: str):
    # Query filtered by PartitionKey = user identity
    entities = self.table_client.query_entities(
        query_filter=f"PartitionKey eq '{user_identity.lower()}'"
    )
    return list(entities)
This means:
- ✅ Sarah can only see Sarah’s scores
- ✅ John can only see John’s scores
- ✅ Training managers would need separate tooling to see aggregated data across all users
- ✅ The application acts as a “gatekeeper” - it has access, but only exposes what you’re allowed to see
Bottom Line: Your performance data is private to you. CORA’s architecture ensures data isolation even though all scores live in the same table!
How CORA uses it:
Table: conversationscores

PartitionKey: user@email.com (your identity)
RowKey: conversation-123 (unique conversation ID)

Data stored:
├─ total_score: 22
├─ professionalism: 5
├─ communication: 4
├─ problem_resolution: 5
├─ empathy: 4
├─ efficiency: 4
├─ strengths: ["Great empathy!", "Clear communication"]
├─ improvements: ["Could respond faster"]
├─ timestamp: 2025-12-21T14:30:00Z
└─ message_count: 8
Why Table Storage?
- ✅ Cheap (~$0.10/GB/month)
- ✅ Fast queries by user identity (PartitionKey)
- ✅ Scales to millions of scores
- ✅ Managed Identity authentication (no passwords!)
- ✅ Perfect for analytics aggregation
- ✅ Built-in data isolation (query by PartitionKey)
🧪 Testing the Analytics Dashboard
Test Scenario 1: Single Conversation Scoring
Objective: Generate and view your first conversation score
Steps:
- Start a new conversation with CORA
- Select “😤 Frustrated & Upset” mood
- Have a 4-5 message conversation:
- Example: “My order never arrived! This is unacceptable!”
- Respond professionally and empathetically
- Propose a solution
- Confirm resolution
- Click “📊 Analyze Conversation”
- Wait for scoring results (5-10 seconds)
- Review your scores and feedback
Expected result:
- Total score displayed (hopefully 18-25!)
- Individual criteria scores visible
- Strengths and improvements listed
- Overall feedback provided
Test Scenario 2: View Analytics Dashboard
Objective: See your performance history
Steps:
- Click “📈 My Analytics” in top-right header
- View the performance chart:
- Should show one data point (your first conversation)
- Lines for all 5 criteria
- View the conversation history table:
- Should show your conversation with timestamp
- Total score and individual criteria visible
Expected result:
- Chart displays correctly (even with just one data point!)
- Table shows conversation details
- No errors in browser console
Test Scenario 3: Track Performance Over Time
Objective: See trends across multiple conversations
Steps:
- Complete 3 more conversations with different moods:
- One with “😊 Happy & Satisfied” mood
- One with “😕 Confused & Unsure” mood
- One with “⏰ Impatient & Urgent” mood
- Analyze each conversation after completion
- Return to analytics dashboard
- Observe performance trends:
- Are you getting better at empathy?
- Is efficiency improving?
- Which criteria are consistently strong?
Expected result:
- Chart shows 4 data points with trend lines
- Table lists all 4 conversations chronologically
- You can identify patterns in your performance!
🛠️ Troubleshooting Common Issues
Issue 1: “My Analytics” Button Shows No Data
Symptoms:
- Dashboard opens but says “No conversations found”
- Chart and table are empty
Possible causes:
- You haven’t analyzed any conversations yet
- Solution: Complete a conversation and click “Analyze Conversation” first
- Different user identity
- Solution: Check the user identity in top-right corner. Scores are tied to your specific identity. If you logged in with a different account, you won’t see previous scores.
- Storage not configured
- Solution: Check Azure Table Storage is deployed (
azd env get-values | grep STORAGE)
- Solution: Check Azure Table Storage is deployed (
Issue 2: Analyze Conversation Button Doesn’t Work
Symptoms:
- Click “Analyze Conversation” but nothing happens
- No scores displayed
Possible causes:
- Conversation too short
- Solution: Have at least 2-3 message exchanges before analyzing
- AI Foundry connection issue
- Solution: Check Azure OpenAI endpoint is correct in environment variables
- Browser console errors
- Solution: Press F12, check Console tab for JavaScript errors
Issue 3: Chart Displays Incorrectly
Symptoms:
- Chart is blank or distorted
- Data points don’t align with table
Possible causes:
- Chart.js not loaded
- Solution: Check browser Network tab, ensure Chart.js CDN loads successfully
- Browser compatibility
- Solution: Use modern browser (Chrome, Edge, Firefox, Safari latest versions)
- Dark mode CSS conflict
- Solution: Try switching between light/dark themes
🎓 Key Takeaways
What You Learned
✅ Analytics dashboard tracks HUMAN agent performance (not IT metrics)
✅ 5-criteria scoring system provides actionable feedback:
- Professionalism & Courtesy
- Communication Clarity
- Problem Resolution
- Empathy & Active Listening
- Efficiency & Responsiveness
✅ Azure Table Storage stores scores for long-term tracking:
- Lightweight and cost-effective
- Queries by user identity
- Managed Identity authentication
✅ Chart.js visualization helps identify trends over time
✅ Performance tracking enables training managers to monitor agent skill development
What’s Next: Module 6
In the next module, we’ll shift focus from human agent metrics to IT/system metrics:
- Application Insights for system health
- OpenTelemetry traces for debugging
- AI Foundry evaluation for model quality
- Azure Monitor for infrastructure monitoring
- Cost optimization and performance tuning
Think of it as: Module 5 taught you to track “how good your agents are.” Module 6 will teach you to track “how healthy your system is.” 🛠️