Module 6: IT Operations & System Metrics
Monitor system health, debug issues, and validate AI quality
Module 6: IT Operations & System Metrics
Duration: 40 minutes
Objective: Learn how to monitor CORA's infrastructure, debug issues with logs and traces, and evaluate AI model quality.
🎯 Learning Objectives
By the end of this module, you will:
- Understand the difference between Module 5 (agent metrics) and Module 6 (system metrics)
- View application logs in Container Apps CLI
- Understand OpenTelemetry traces in Application Insights
- Use AI Foundry evaluation tools to assess model quality
- Monitor costs and performance
- Earn your “Low-Code to Pro-Code Architect Navigator” certificate! 🏆
🧭 Module 6 vs Module 5: What’s the Difference?
Reminder from Module 5:
| Aspect | Module 5: Agent Metrics | Module 6: System Metrics |
|---|---|---|
| Focus | How well are agents performing? | How healthy is the system? |
| Who cares | Training managers, HR, QA | DevOps, IT ops, developers |
| Metrics | Professionalism, empathy, scores | Latency, errors, token usage |
| Storage | Azure Table Storage | App Insights, Azure Monitor |
| Tools | Chart.js dashboard | CLI logs, traces, AI Foundry |
This module = System health, not agent performance!
This module = System health, not agent performance!
📋 Application Logging with Container Apps CLI
What Are Application Logs?
Application logs are the real-time output from your Python Flask application running in Azure Container Apps:
- ✅ Startup messages (“✓ Azure Monitor OpenTelemetry configured”)
- ✅ HTTP request logs (GET /chat, POST /api/analyze)
- ✅ Success confirmations (“✓ Stored score for conversation…”)
- ✅ Error messages (“⚠ Failed to initialize Azure Table Storage”)
- ✅ Python print() statements from your code
- ✅ Flask routing information
Think of it as: The console output you’d see if you ran python app.py locally, but captured in the cloud!
Why CLI Logging Matters
When things go wrong in production, you need to know:
Debugging scenarios:
- ❌ Website returns 500 error → Check logs for Python stack trace
- ❌ Scores not saving → Look for “Failed to store score” messages
- ❌ AI not responding → Check for “OpenAI API connection failed”
- ❌ Slow performance → Review request duration logs
Success validation:
- ✅ Deployment worked → See “✓ Azure Monitor OpenTelemetry configured”
- ✅ Storage connected → See “✓ Azure Table ‘conversationscores’ already exists”
- ✅ Requests processing → See “GET /chat 200 OK”
Viewing Logs in Azure CLI
Method 1: Stream Live Logs
# Get your Container App name (from Module 2)
azd env get-values | grep AZURE_CONTAINER_APP_NAME

# Stream live logs (like tail -f in Linux)
az containerapp logs show \
  --name <your-app-name> \
  --resource-group <your-resource-group> \
  --follow \
  --tail 100
What you’ll see:
2025-12-21T15:30:12Z ✓ Azure Monitor OpenTelemetry configured
2025-12-21T15:30:12Z  * Running on http://0.0.0.0:5000/
2025-12-21T15:30:45Z INFO:werkzeug:192.168.1.1 - - [21/Dec/2025 15:30:45] "GET /chat HTTP/1.1" 200 -
2025-12-21T15:31:02Z ✓ Stored score for conversation abc-123 by sarah@company.com
Method 2: Query Recent Logs
# Get last 50 log entries (not live)
az containerapp logs show \
  --name <your-app-name> \
  --resource-group <your-resource-group> \
  --tail 50
Method 3: Azure Portal
- Go to Azure Portal
- Navigate to your Container App (search by name)
- Click “Monitoring” → “Log stream” (left sidebar)
- View live logs in browser (no CLI needed!)
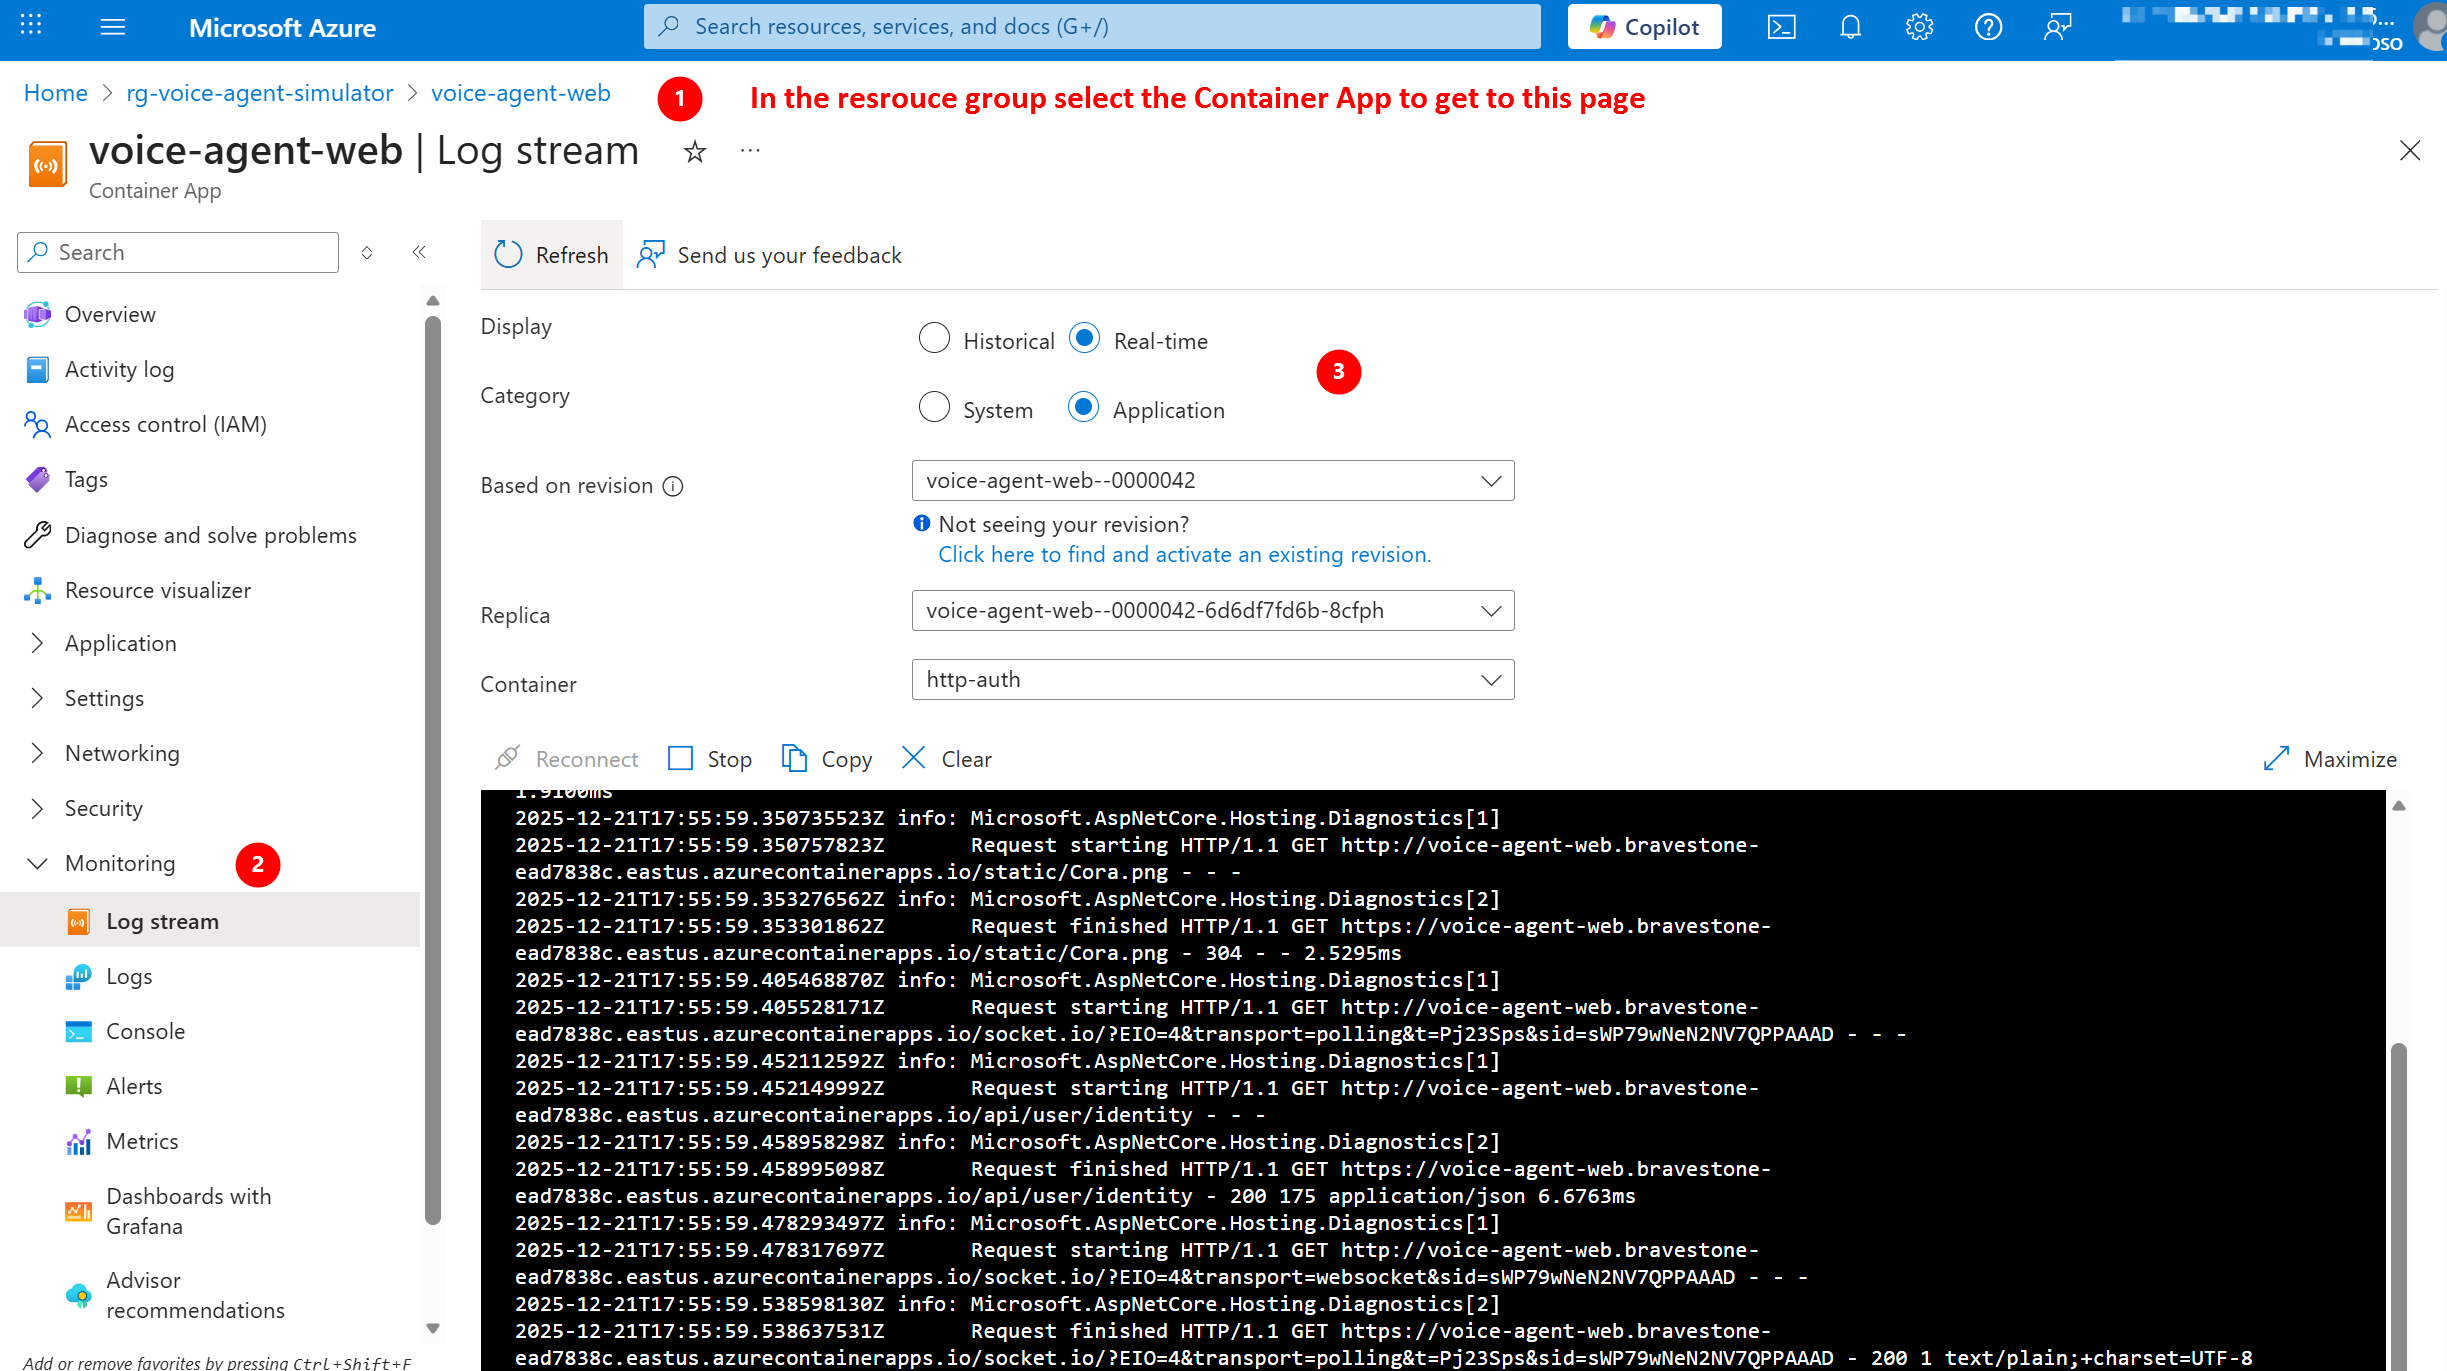
Click to enlarge
Common Log Messages Decoded
✅ Success Messages:
| Log Message | What It Means |
|---|---|
✓ Azure Monitor OpenTelemetry configured |
App Insights telemetry working |
✓ Using Azure Storage connection string |
Storage accessible (local dev mode) |
✓ Using managed identity for storage |
Managed Identity auth working (production) |
✓ Azure Table 'conversationscores' already exists |
Table Storage ready |
✓ Stored score for conversation... |
Score saved successfully |
200 - in HTTP logs |
Request succeeded |
⚠️ Warning Messages:
| Log Message | What It Means | How to Fix |
|---|---|---|
⚠ APPLICATIONINSIGHTS_CONNECTION_STRING not set |
App Insights not configured | Check Module 1 setup, verify connection string |
⚠ No storage account configured |
Storage not accessible | Verify azd env get-values | grep STORAGE |
⚠ Failed to store score in Azure Table |
Write permission issue | Check Managed Identity role (Storage Table Data Contributor) |
404 - in HTTP logs |
Page/route not found | Check URL, verify Flask routes in app.py |
500 - in HTTP logs |
Server error | Check Python stack trace in logs |
❌ Error Messages:
| Log Message | What It Means | How to Fix |
|---|---|---|
Failed to initialize Azure Table Storage |
Can’t connect to Storage | Check firewall rules, Managed Identity, connection string |
OpenAI API connection failed |
Can’t reach AI Foundry | Verify AZURE_OPENAI_ENDPOINT in env variables |
Azure AD token refresh failed |
Authentication expired | Run az login again, check token expiration |
| Python stack traces (Traceback…) | Code error | Review the specific error message and file/line number |
Testing Log Scenarios
Test Scenario 1: View Startup Logs
Objective: Verify application started successfully
Steps:
- Open terminal/command prompt
- Run:
az containerapp logs show --name <your-app-name> --resource-group <your-rg> --tail 100 - Look for startup sequence:
- Flask initialization
- OpenTelemetry configuration
- Storage connection
- “Running on http://0.0.0.0:5000/”
Expected result:
- All ✓ checkmarks visible
- No ❌ errors in startup sequence
- Flask server running
Test Scenario 2: Monitor Live Requests
Objective: See HTTP requests in real-time
Steps:
- Run:
az containerapp logs show --name <your-app-name> --resource-group <your-rg> --follow - Open CORA in browser
- Start a new conversation
- Send a message to the AI
- Watch logs update in terminal
Expected result:
- See
GET /when page loads - See
POST /chatwhen you send message - See
200status codes (success) - See “✓ Stored score…” after analyzing conversation
Test Scenario 3: Diagnose an Error
Objective: Use logs to troubleshoot a 500 error
Steps:
- Intentionally break something (e.g., remove AI endpoint from config)
- Try to send a message in CORA
- See 500 error in browser
- Check logs:
az containerapp logs show --name <your-app-name> --resource-group <your-rg> --tail 50 - Look for Python Traceback or error messages
Expected result:
- Logs reveal the specific error (e.g., “OpenAI endpoint not configured”)
- Stack trace shows which file and line number caused the issue
- You can fix the configuration and verify success in logs
📡 OpenTelemetry Traces in Application Insights
What Are Traces?
Traces show the complete journey of a request through your application:
User clicks "Send Message"
  ↓
Flask receives POST /chat
  ↓
agent.process_message() called
  ↓
Azure OpenAI API call (GPT-4o)
  ↓
Token usage tracked
  ↓
Response returned to user
Each step is a “span” with duration, status, and custom attributes.
Viewing Traces in Application Insights
Prerequisites:
- Application Insights must be configured (done in Module 1!)
APPLICATIONINSIGHTS_CONNECTION_STRINGset in environment
Method 1: Azure Portal
- Go to Azure Portal
- Navigate to your Application Insights resource
- Click “Transaction search” (left sidebar)
- Filter by:
- Time range (last hour, last 24 hours)
- Event type (Requests, Dependencies, Traces)
- Result code (200, 500, etc.)
Click to enlarge
Method 2: Performance Tab
- In Application Insights, click “Performance” (left sidebar)
- View:
- Average response times
- Slowest operations
- Failed requests
- Dependency calls (Azure OpenAI, Storage)
Click to enlarge
Custom Attributes in CORA
CORA’s agent.py adds custom span attributes for business context:
| Attribute | What It Tracks | Why It Matters |
|---|---|---|
cora.mood |
Customer emotion | Correlate mood with errors/latency |
cora.message_length |
Input size (characters) | Identify long messages causing issues |
cora.model |
Model used (gpt-4o) | Compare performance across models |
cora.prompt_tokens |
Input tokens | Track cost drivers |
cora.completion_tokens |
Output tokens | Optimize response length |
cora.total_tokens |
Combined tokens | Calculate per-conversation cost |
cora.response_length |
Output size (characters) | Measure verbosity |
Example trace view:
Span: cora.process_message
Duration: 1,247ms
Status: Success ✅

Custom Attributes:
├─ cora.mood: frustrated
├─ cora.message_length: 87
├─ cora.model: gpt-4o
├─ cora.prompt_tokens: 245
├─ cora.completion_tokens: 189
├─ cora.total_tokens: 434
└─ cora.response_length: 312
Use cases:
- “Which mood causes the most errors?” → Filter by
cora.mood - “Are long messages slower?” → Correlate
cora.message_lengthwith duration - “What’s our daily token usage?” → Aggregate
cora.total_tokens
🧪 AI Foundry Evaluation Tools
What Is AI Evaluation?
AI evaluation assesses the quality of your model’s responses against objective criteria:
| Metric | What It Measures | Why It Matters |
|---|---|---|
| Groundedness | Factual accuracy (no hallucinations) | Prevents making up information |
| Relevance | On-topic responses | Stays focused on customer issue |
| Coherence | Logical flow, well-structured | Easy to understand |
| Fluency | Grammar, natural language | Sounds professional |
Think of it as: Automated quality assurance for AI responses (like spell-check for intelligence)
Accessing AI Foundry Evaluation
Where to find it:
- Go to ai.azure.com or oai.azure.com
- Navigate to your AI Foundry project (created in Module 1)
- Click “Evaluation” (left sidebar)
Click to enlarge
Manual Evaluation in Playground
Quick test in Playground:
- Go to “Playground” → “Chat”
- Send test prompts with different moods:
- “I’m so frustrated! My order is late!” (frustrated)
- “Can you help me understand how this works?” (confused)
- “This is urgent! I need help now!” (impatient)
- Review responses for:
- ✅ Appropriate empathy for mood
- ✅ Clear, actionable solutions
- ✅ Professional tone
- ✅ No hallucinations or made-up facts
Red flags:
- ❌ Generic responses (not mood-aware)
- ❌ Overly verbose or rambling
- ❌ Making promises CORA can’t keep (“I’ll refund you $100”)
- ❌ Inappropriate tone (too casual or too robotic)
Automated Evaluation (Advanced)
For production use: Set up automated evaluation pipelines
What you need:
- Test dataset (choose one of these options):
- Upload CSV/JSON with sample customer messages
- Use stored completions from your Azure OpenAI deployment (recommended!)
- Expected outputs (ideal responses) - optional if using stored completions
- Evaluation metrics (groundedness, relevance, etc.)
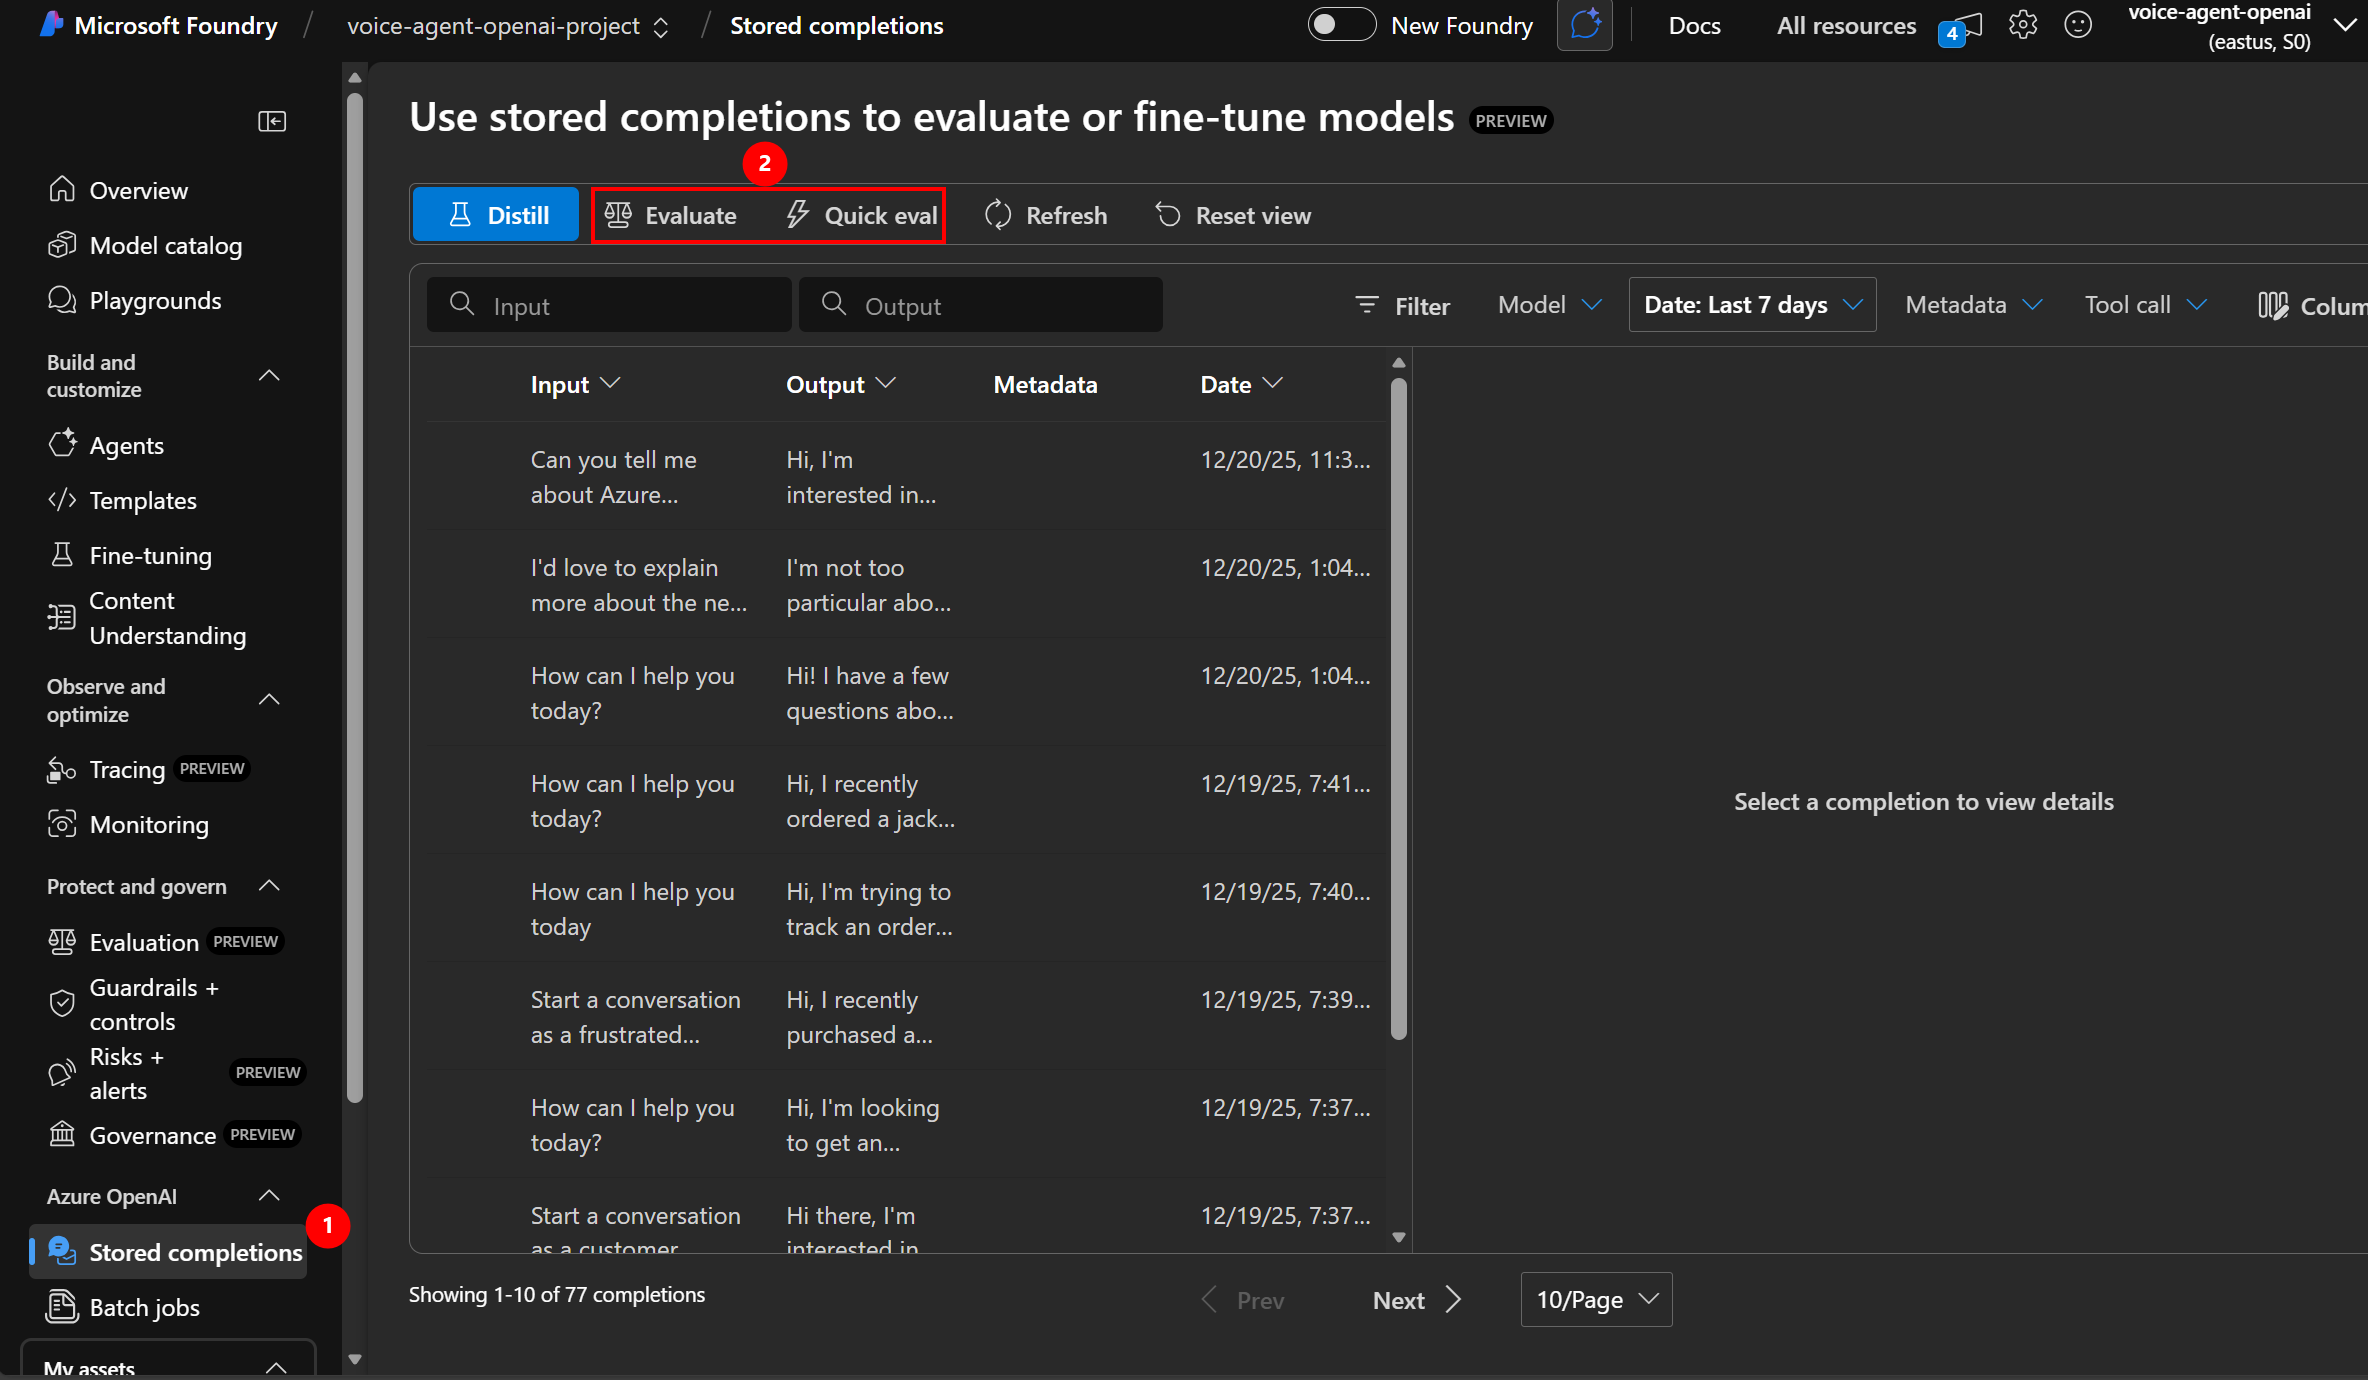
💡 Pro Tip: Use Stored Completions!
Azure OpenAI automatically stores your chat completions. Instead of creating test datasets from scratch, you can:
- Run CORA in production for a few days
- Go to AI Foundry → “Evaluation” → “New evaluation”
- Select “Imported from Chat Completions” as your input source
- Azure automatically pulls real conversations from your deployment
- Evaluate how well your model performed on actual user interactions!
Benefits:
- ✅ No manual test dataset creation needed
- ✅ Real-world conversations (not synthetic examples)
- ✅ Reflects actual user patterns and edge cases
- ✅ Quickly identify quality issues in production
How it works:
- Import stored completions OR upload test dataset to AI Foundry
- Select evaluation metrics (groundedness, relevance, coherence, fluency)
- Run evaluation job (AI scores each response)
- Review scores and identify issues
- Iterate on system prompts to improve quality
Example custom test dataset (if not using stored completions):
mood,input,expected_output
frustrated,"My order is late!","I understand your frustration..."
confused,"How does this work?","Let me explain step-by-step..."
happy,"This is great!","I'm so glad to hear that!"
Not required for this workshop - but good to know for production!
💰 Monitoring Costs & Performance
Token Usage & Cost Tracking
How CORA tracks costs:
Every conversation logs:
- Prompt tokens (input to GPT-4o)
- Completion tokens (output from GPT-4o)
- Total tokens (prompt + completion)
Cost calculation:
| Model | Input Cost | Output Cost | Avg Conversation |
|---|---|---|---|
| GPT-4o | $2.50 per 1M tokens | $10 per 1M tokens | ~$0.006 per conversation |
| GPT-5 | $30 per 1M tokens | $60 per 1M tokens | ~$0.035 per conversation |
CORA average conversation:
- Prompt: ~250 tokens ($0.000625)
- Completion: ~200 tokens ($0.002)
- Total: ~$0.0026 per conversation
1,000 conversations = ~$2.60 💰
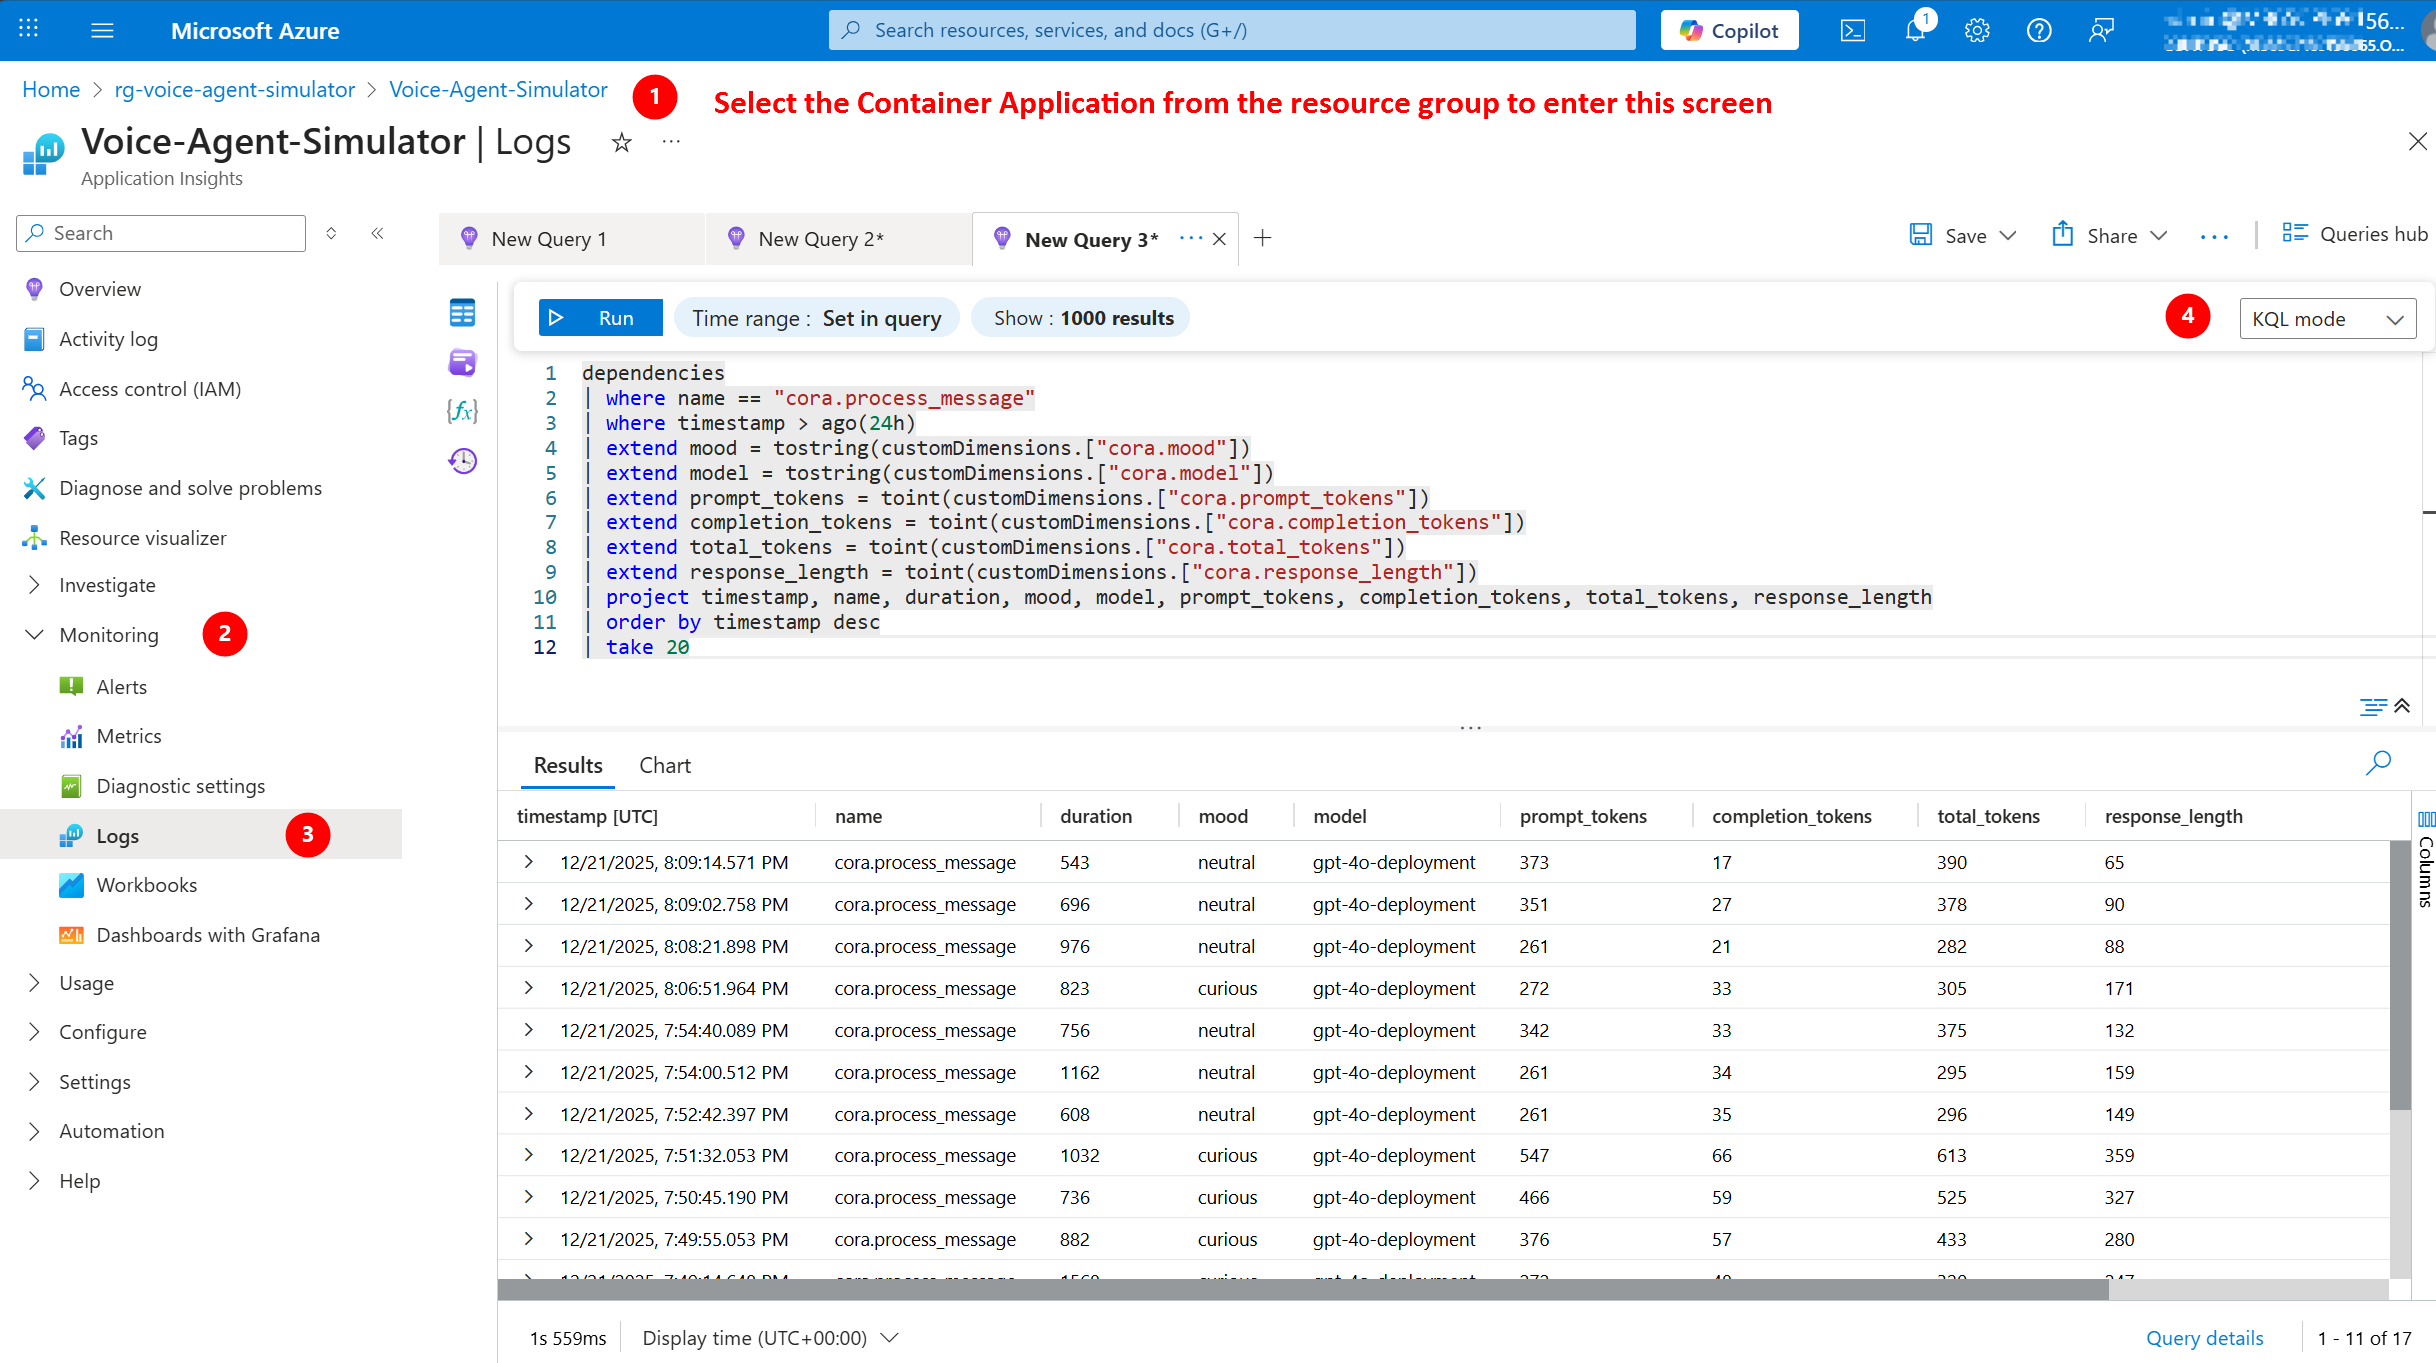
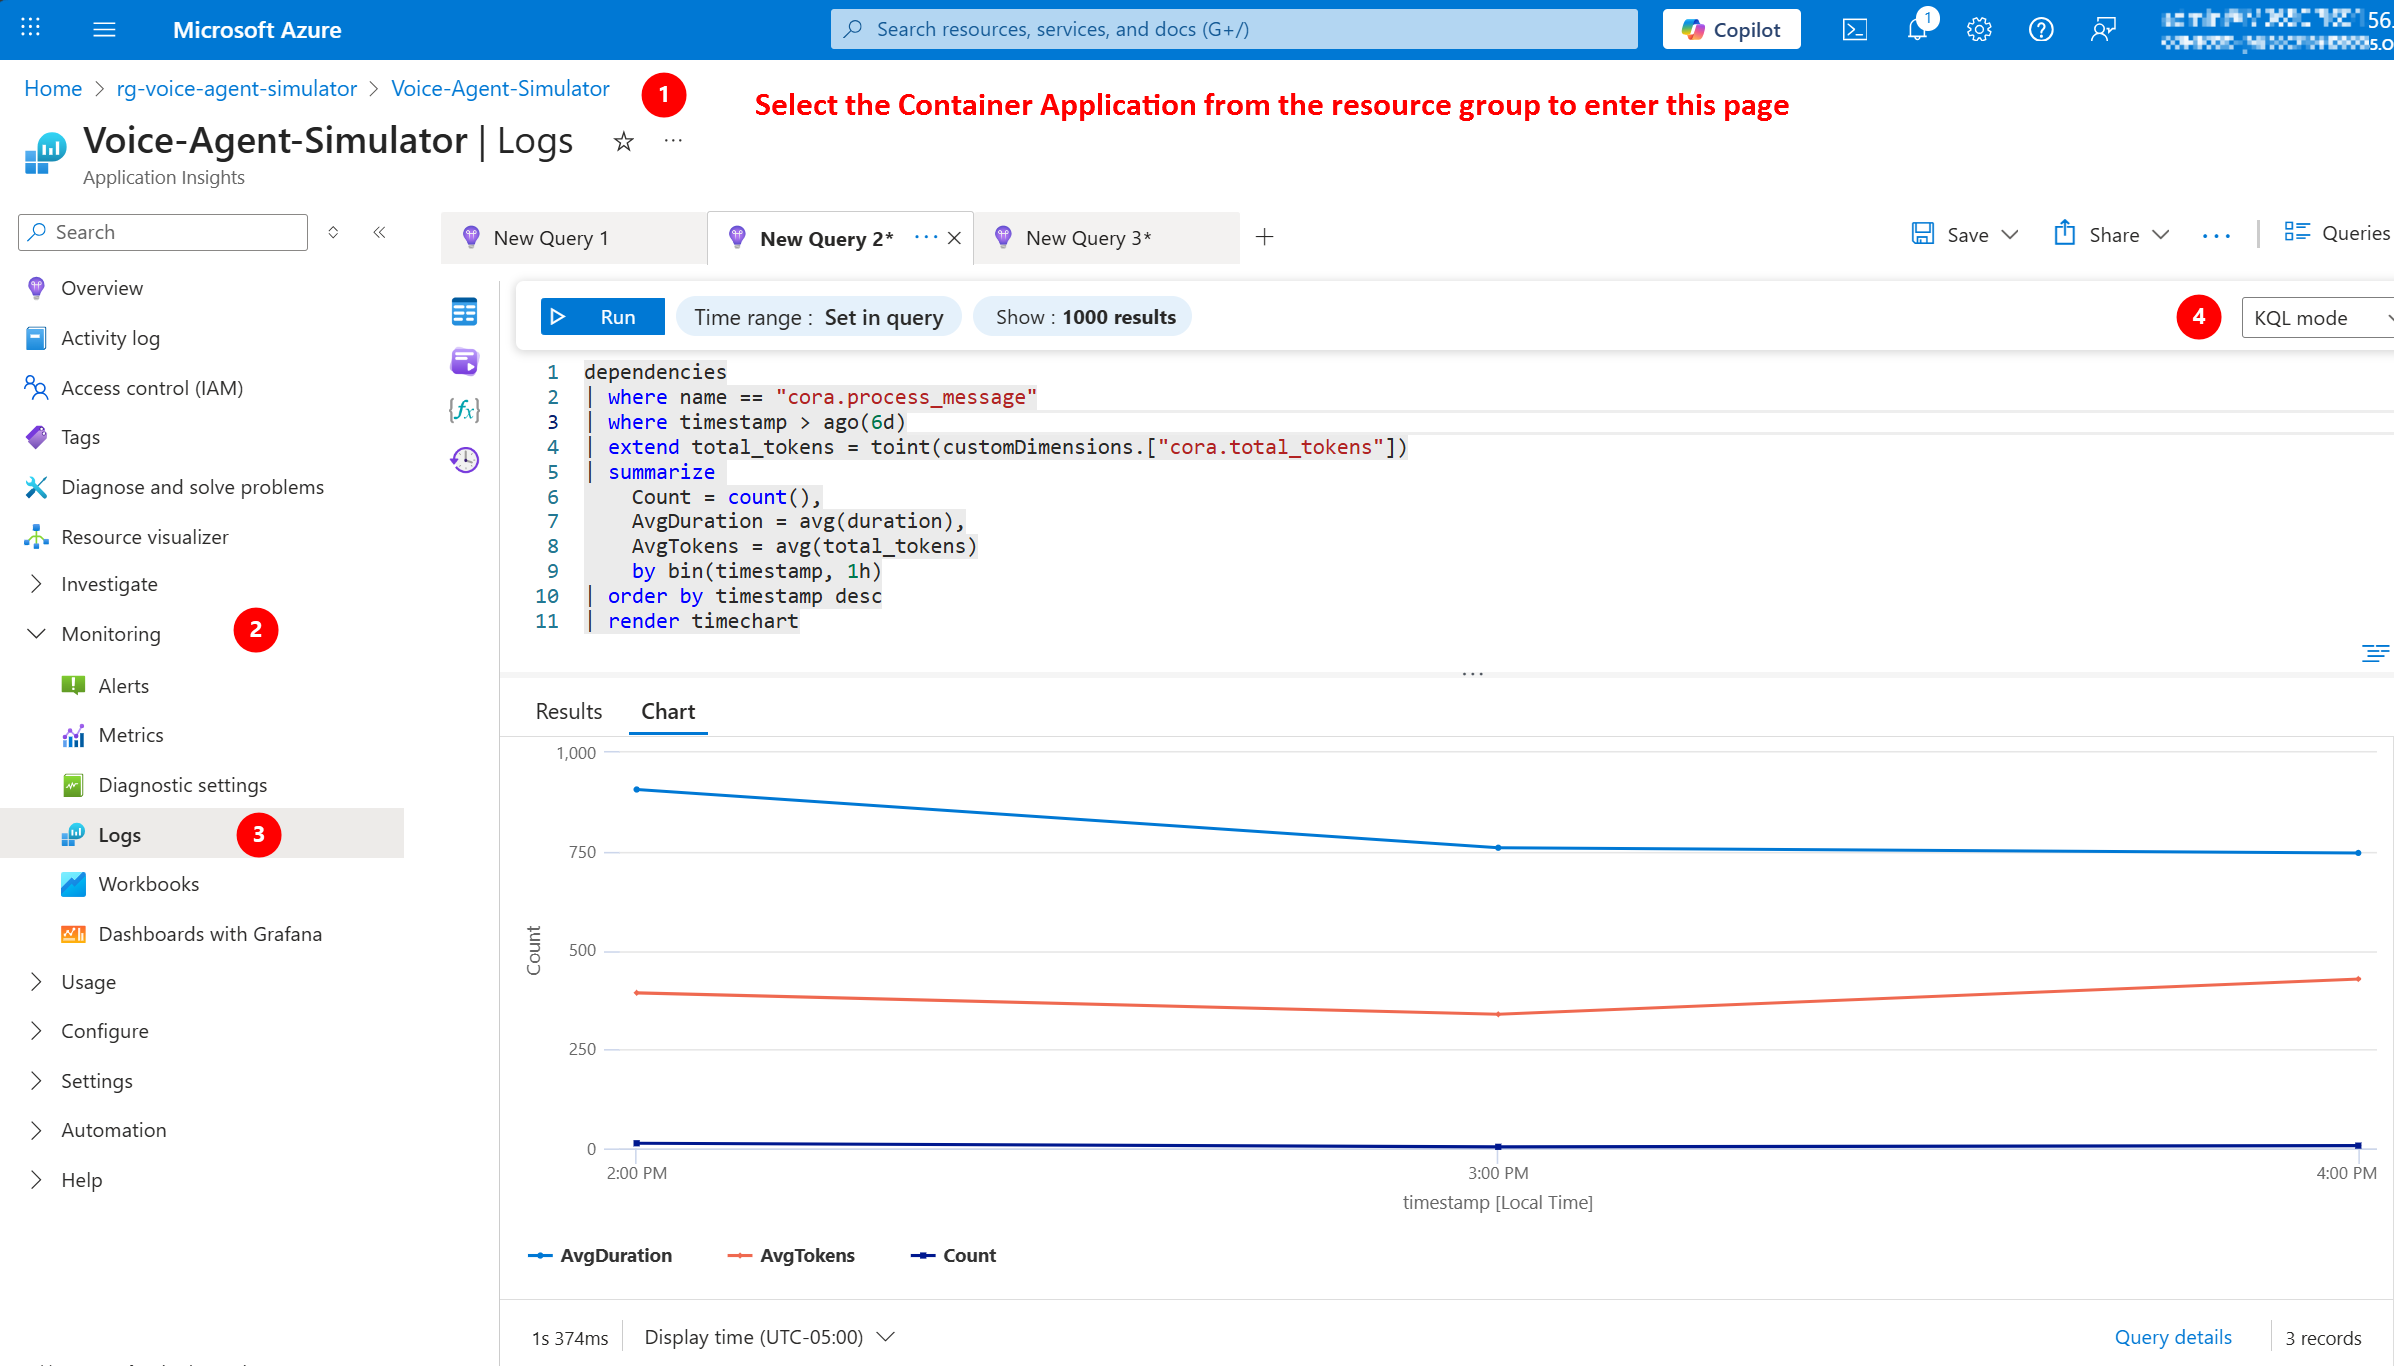
Viewing Token Usage
Method 1: Application Insights
- Go to Application Insights → “Logs”
- Run this query:
traces
| where customDimensions.cora_total_tokens > 0
| summarize
    TotalConversations = count(),
    TotalTokens = sum(tolong(customDimensions.cora_total_tokens)),
    AvgTokens = avg(tolong(customDimensions.cora_total_tokens))
| project TotalConversations, TotalTokens, AvgTokens
Expected result:
TotalConversations: 42
TotalTokens: 18,900
AvgTokens: 450
Method 2: AI Foundry Portal
- Go to AI Foundry → your project
- Click “Monitoring” (left sidebar)
- View application analytics and resource usage:
- Total requests (conversations)
- Token usage over time
- Estimated costs
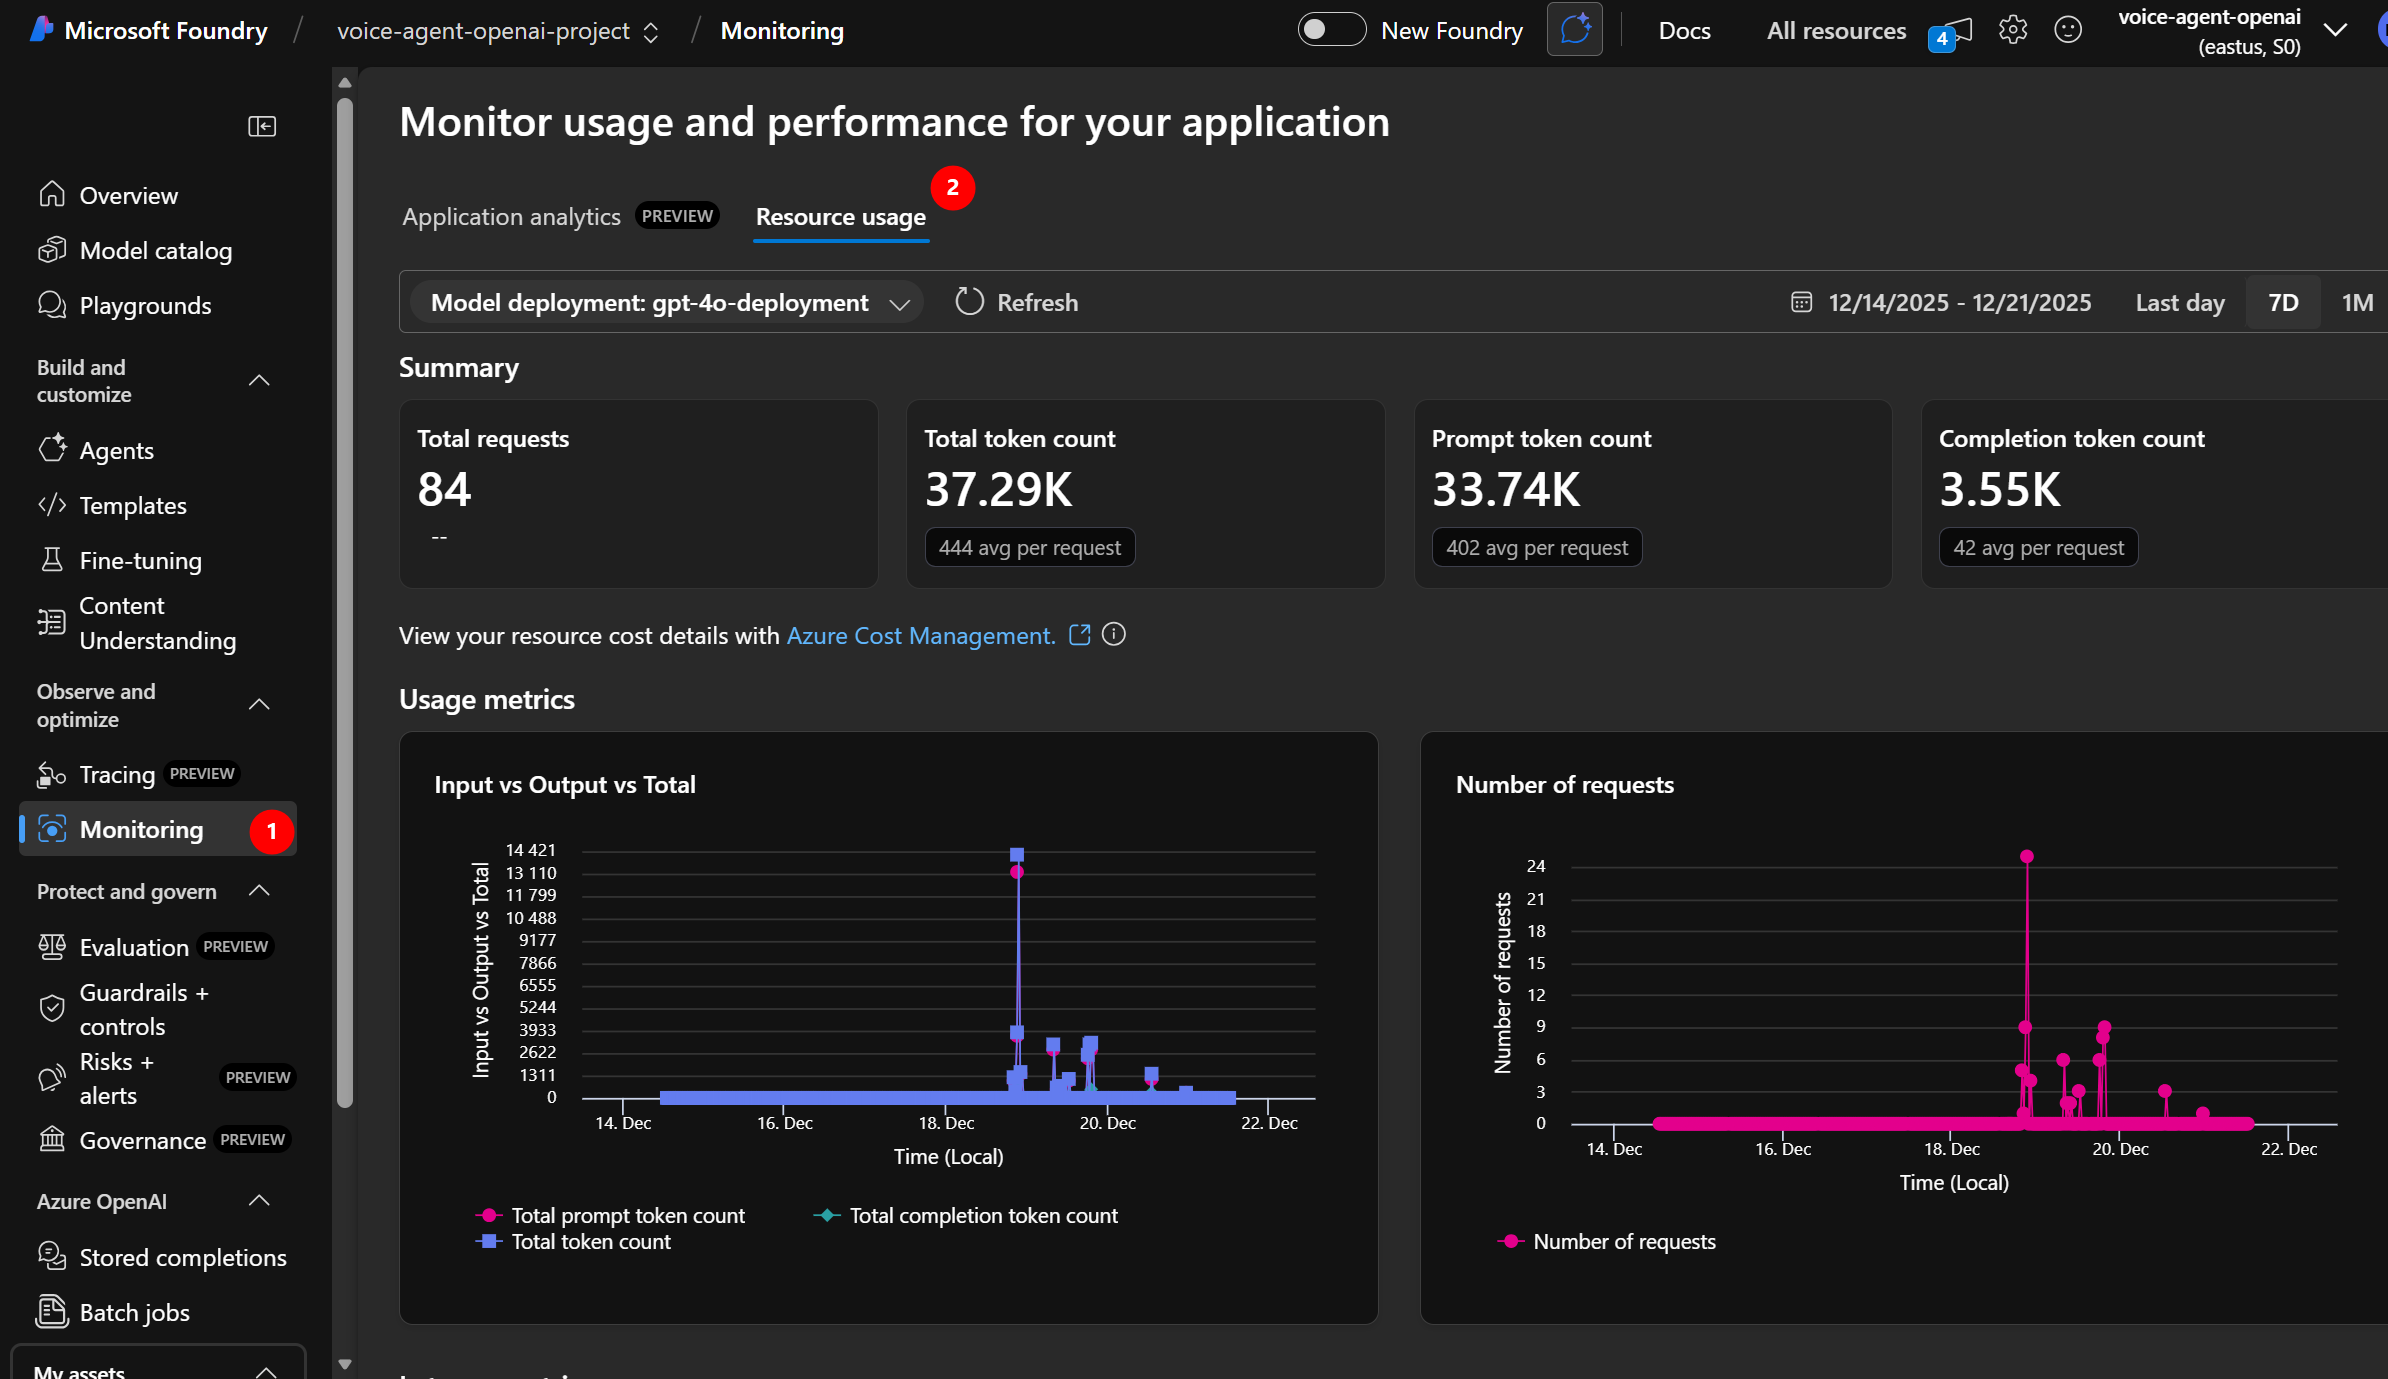
Click to enlarge
Cost Optimization Tips
1. Shorten System Prompts
- Current: ~150 tokens per conversation
- Optimized: ~80 tokens (cut fluff, keep clarity)
- Savings: ~$0.0002 per conversation
2. Limit Conversation History
- CORA tracks full conversation in context
- For long conversations (10+ messages), trim older messages
- Keep only last 5 messages in context
3. Set Max Tokens
- Prevent runaway responses
max_tokens=500(reasonable for customer service)- Avoids $10 surprise bills from verbose AI
4. Use GPT-4o-mini for Simple Tasks
- 60% cheaper than GPT-4o
- Good for simple Q&A, classification
- CORA uses GPT-4o for quality, but consider mini for high-volume production
🎓 Key Takeaways
What You Learned
✅ Application Logging = Real-time app output in Container Apps CLI
- View startup messages, HTTP requests, errors
- Debug 500 errors with stack traces
- Monitor live activity with
--follow
✅ OpenTelemetry Traces = Request journey through your system
- View in Application Insights (Transaction search, Performance)
- Custom attributes track mood, tokens, duration
- Correlate business metrics (mood) with technical metrics (latency)
✅ AI Foundry Evaluation = Automated quality assurance for AI
- Metrics: Groundedness, relevance, coherence, fluency
- Manual testing in Playground
- Automated pipelines for production
✅ Cost Monitoring = Track token usage and optimize spending
- Application Insights logs show token counts
- AI Foundry metrics dashboard shows usage trends
- Optimization: Shorten prompts, limit history, set max_tokens
Next Steps Beyond This Workshop
🎯 Customize CORA for your needs:
- Modify system prompts for your industry
- Add more customer moods
- Integrate with real CRM systems
- Deploy to production
📚 Learn more about Azure AI:
- Azure AI Foundry Documentation
- Azure OpenAI Service
- Container Apps Best Practices
- Azure Well-Architected Framework
🤝 Share your success:
- Show CORA to your team
- Present at internal tech talks
- Contribute improvements to the GitHub repo
- Help others learn Azure AI!
🏆 Congratulations! Claim Your Certificate
You’ve completed all 6 modules of the CORA Voice Agent Workshop! It’s time to celebrate your achievement!
Next Steps Beyond This Workshop
🎯 Customize CORA for your needs:
- Modify system prompts for your industry
- Add more customer moods
- Integrate with real CRM systems
- Deploy to production
📚 Learn more about Azure AI:
- Azure AI Foundry Documentation
- Azure OpenAI Service
- Container Apps Best Practices
- Azure Well-Architected Framework
🤝 Share your success:
- Show CORA to your team
- Present at internal tech talks
- Contribute improvements to the GitHub repo
- Help others learn Azure AI!
🔗 Resources
- Application Insights Documentation
- Azure AI Foundry Evaluation
- Container Apps Logging
- OpenTelemetry Python